Origin 2027 Feature Highlights

Sticky Notes
Origin now lets you attach sticky notes directly to windows, giving you a quick, visible way to capture comments, reminders, or context right alongside your data and graphs.
Key features include:
- Attach one or more sticky notes to window. With workbooks, you can attach notes to individual sheets or to the workbook
- Choose from a list of colors or a custom color to organize or categorize notes visually
- Copy and paste sticky notes to other windows
- Minimized sticky notes stack vertically or horizontally
- Preview note text by mousing over a minimized window, or over a window's icon in the Project Explorer
- Spot windows with notes at a glance via indicators on the title bar button, the minimized window icon, the Project Explorer icon, and the sheet tab
- See sheet-level sticky note indicator directly in the Object Manager
- Search sticky note content directly from the Project Browser dialog and the Find in Project Files dialog
- Set preferences for sticky notes — such as showing notes for inactive windows and preventing notes from being dragged outside the window
- Delete sticky notes at window level or across the project (using del -sn LabTalk command)
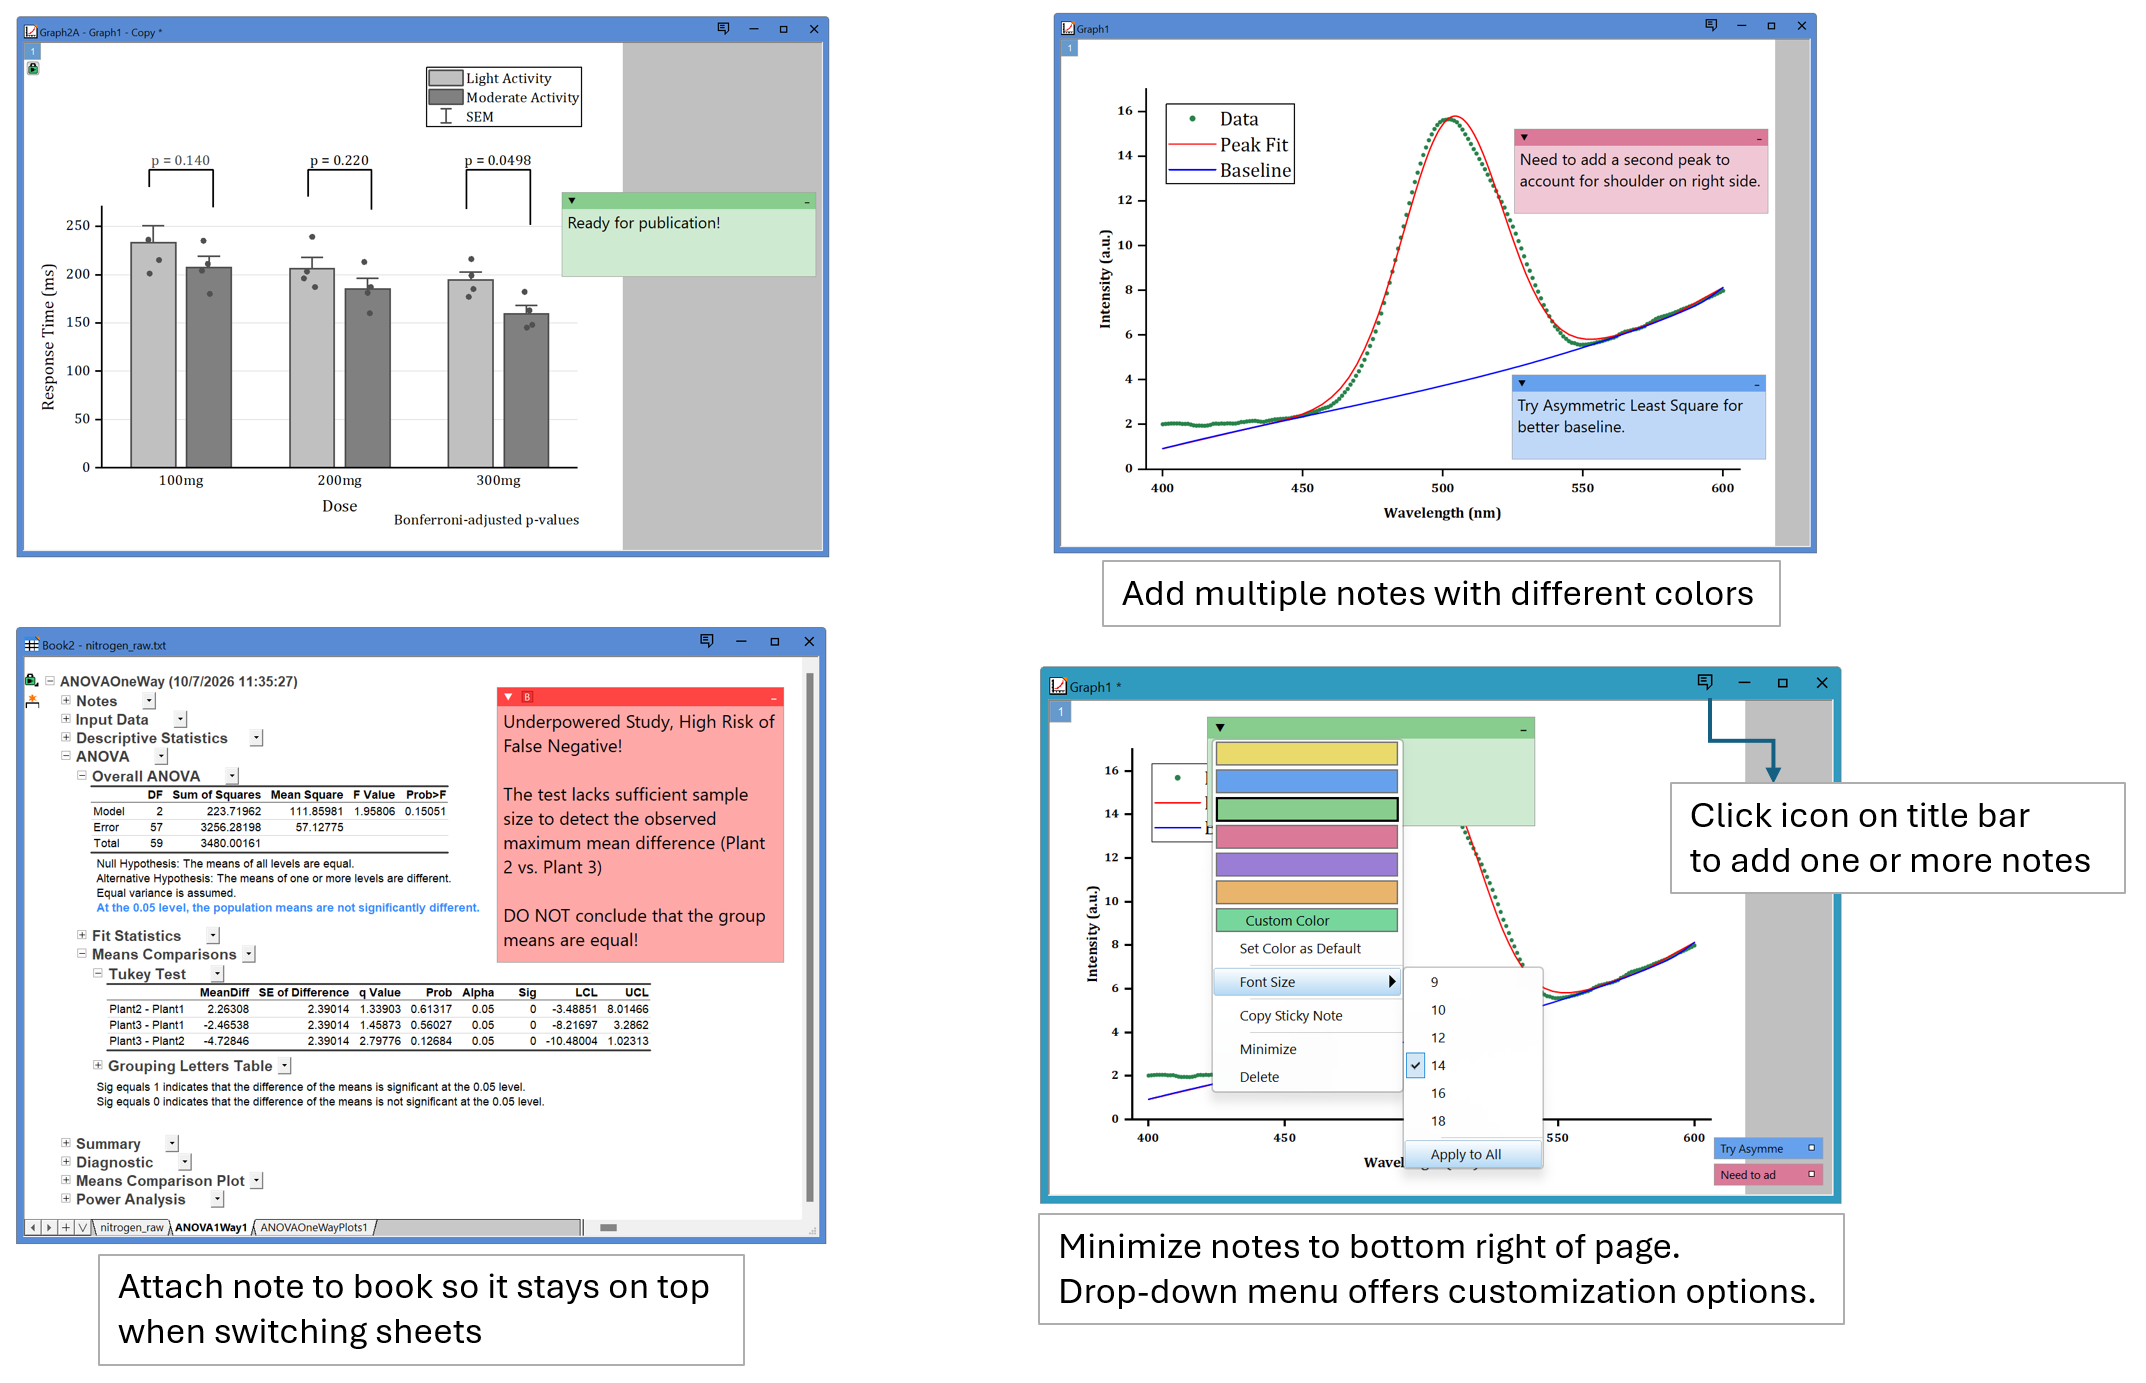
Sticky Notes — Add color-coded notes to graphs, workbooks, and sheets to capture important comments and context.
Multiple Comparisons and Significance Plots
Easily create multiple comparisons and significance plots directly from ANOVA and t-test report sheets. Statistical results are automatically carried over to the plots, eliminating manual setup.
Key features include:
- Directly from Analysis Reports: Launch the plot dialog from an icon in the report sheet.
- Supported Analyses: Create Multiple Comparisons Plot from One-Way ANOVA, Two-Way ANOVA, Two-Sample t-Test, Paired t-Test and Corresponding Non-parametric analyses reports. Create Significance Plot from One-Sample t-Test reports.
- Automatic Results Transfer: Statistical results are automatically applied to the plots.
- Publication-Ready Styling: Create plots with thicker axes, vivid colors, and bold text.
- Multiple Plot Types: Choose Bar, Box, Violin, or Scatter plots with SD, SEM, or 95% CI error bars.
- Flexible Significance Annotations: Customize brackets and annotations, place brackets outside the plot area, and show only p-values that meet a specified threshold.
Enhancements to Life Science Features
Several new features have been added for Life Science related graphing and analysis:
- Western Blot and qPCR Assays
- Multiple Comparisons and Significance Plots
- IC50/EC50 lines in fit results graphs
- Auto-recalculation on data structure changes to data tables
- More Life Science related fitting functions
- Outlier removal using Robust Regression
Monte Carlo Simulation
Explore uncertainty, evaluate process capability, identify key factors, and optimize model inputs with an enhanced Monte Carlo Simulation tool.
Key Features:
- Modern Model Builder: Define inputs, outputs, equations, and function groups with a visual model preview.
- Import Existing Models: Build simulations from DOE, GLR, NLFit reports, or worksheet data.
- Expanded Probability Distributions: Choose from many distributions, including Triangular and Truncated Normal, or identify suitable distributions from sample data.
- Capability Reports: View output distributions, Cpk/Ppk, DPMO, percent out of specification, and editable specification limits.
- Sensitivity Analysis: Identify influential inputs with line + symbol plots or filtered tornado charts.
- Parameter Optimization: Optimize controllable inputs to improve capability, reduce variation, or minimize out-of-specification results.
Enhancements to Quality Improvement Tools
Expanded tools for process control, capability analysis, experimental design, reliability, measurement systems, and stability studies give you greater flexibility in analyzing real-world quality and manufacturing data:
- Statistical Process Control: New G and T charts for rare events, plus nonnormal and nonparametric options for I-MR and Individuals charts.
- Process Capability: New automated, nonparametric, and machine capability analyses handle a broader range of process-data conditions.
- Design of Experiments: New 2-level split-plot designs for experiments with hard-to-change factors.
- Reliability Analysis: New Distribution Identification and Distribution Overview for arbitrarily censored data, plus additional threshold-parameter distributions for right-censored data.
- Gage Studies: Gage R&R reports now include a conclusion chart, and a new standalone Run Chart tool is available.
- Stability Study: Treat batch as a random factor and use mixed-effects modeling to account for between-batch variability.
- Monte Carlo Simulation: A completely redesigned Monte Carlo Simulation app.
Tree View for Workbooks in Object Manager
The Object Manager now offers a Tree View for workbooks, giving you a clearer, more structured way to see how analysis operations and their output sheets relate to each other.
Key features include:
- Toggle between the existing List View and the new Tree View using an icon on the Object Manager's title bar
- Tree View groups each analysis operation together with its output sheets, making it easy to trace how a sheet (such as Nonlinear Curve Fit) was derived
- Option to hide result sheets below operation node to view only the analysis relationships
- Click on operation lock to jump to the corresponding result sheet
- Double click on operation lock to change parameters
- Right-click an operation node for quick actions: Change Parameter, Recalculate Mode, Go to Source, Go to Report, Delete, etc.
- Right-click a book, an operation, or blank area to access global Tree View settings
New Compact Mode plus Easy GUI Mode Switching
This version introduces a Compact GUI Mode that is suitable for users who prefer to have a simpler interface:
- Fewer toolbars docked on interface by default
- Project Explorer and Object Manager are docked together on the right
- Basic plot type buttons on the left, and common graph annotation buttons on top right
You can also easily switch between the four available GUI modes from the Preferences menu:
Default, Life Science, Stats, Compact
Note that Life Science and Stats GUI Modes need to be turned on during installation if you prefer to have those accessible.
Enhancements to Origin C
Origin C now supports modern language features, new container classes and multi-threaded loops, along with productivity improvements in Code Builder, so code is shorter, safer and faster.
Key features include:
- Multi-threaded ffor() loop for faster execution of compute-heavy tasks such as matrix operations
- New oset and omap classes for sets and maps, plus support for vectors of simple structs and a copy constructor for vector
- New override and __super keywords, so the compiler flags a derived method that no longer matches its base class, and an override can call the base implementation
- Modern syntax, including auto, nullptr, static_assert, switch() over strings, range-based for() and variable initialization inside if() and switch()
- JSON conversion to and from strings for matrix objects
- Code Builder improvements: Sticky Scroll to keep your place in long code, drag-and-drop of files to other apps, and a Profiler (Debug menu or Profiler class) to find slower functions
Read more...
New Graph Types
The following new graph types have been added in this version:
- Hexbin Plot
- Binned Scatter Plot
- UpSet Plot
- Multiple Comparisons Plot
- Significance Plot
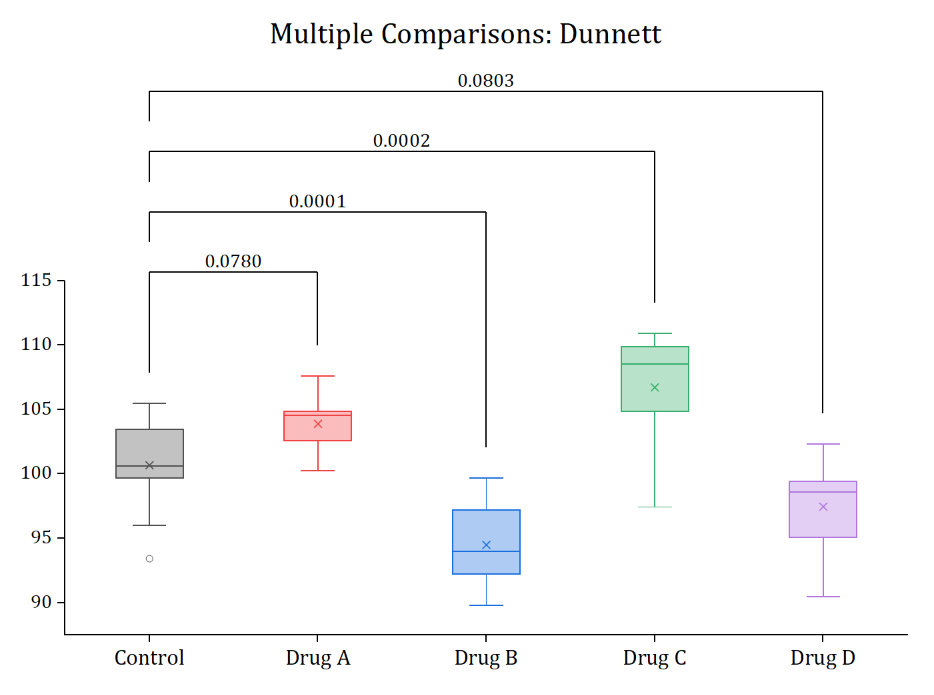
Multiple Comparisons Plot: One-Way ANOVA
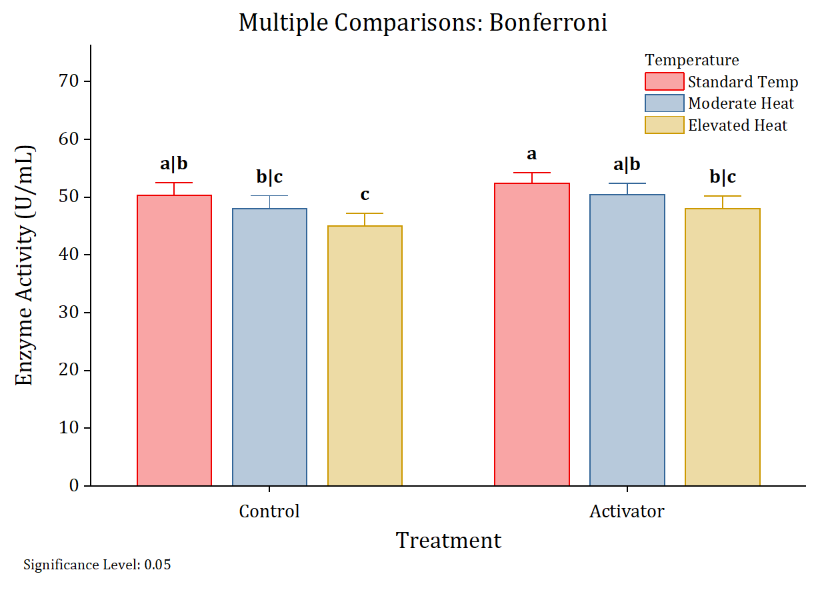
Multiple Comparisons Plot: Two-Way ANOVA
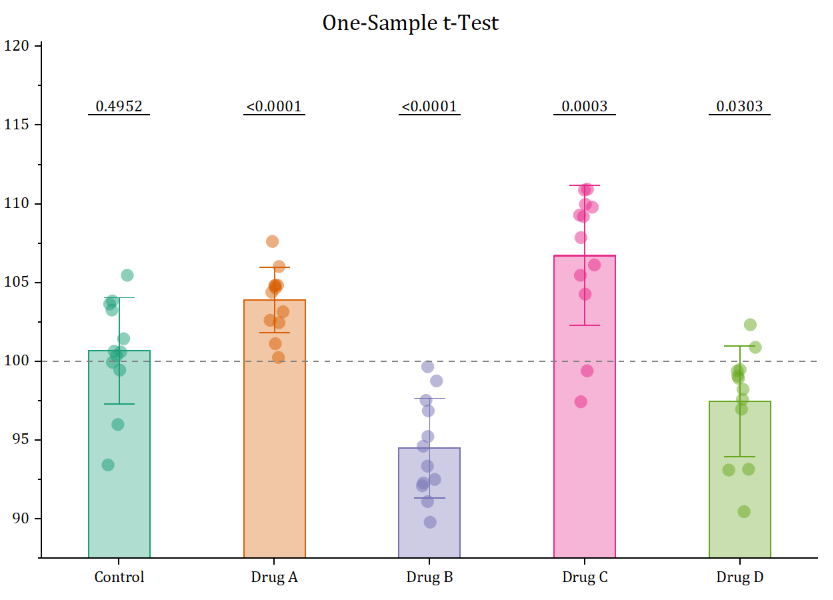
Significance Plot: One-Sample t-Test
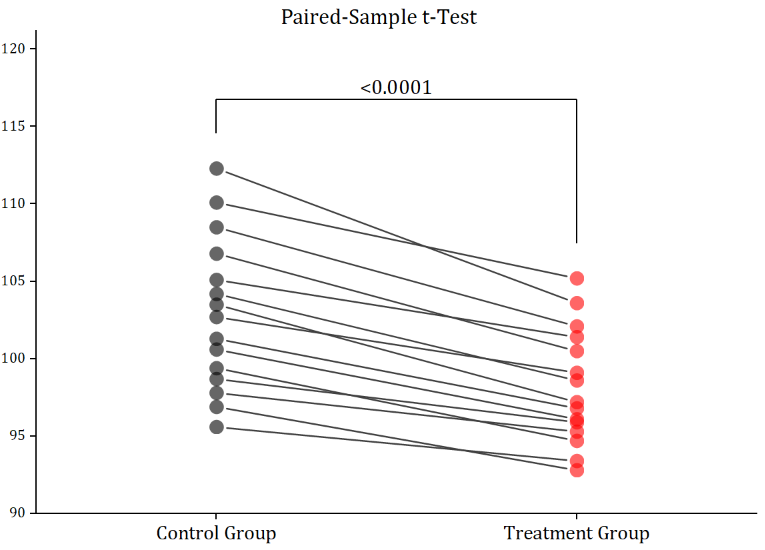
Multiple Comparisons: Paired-Sample t-Test
New and Updated Apps
The following new/updated Apps are available with this latest version:
Other Features
General
- Auto-Detect Long Names and Units in Text File Headers
- Window title in Object Manager now matches the displayed title of the child window
- In-place edit sheet or layer name by double-clicking it or single click it twice in Object Manager
- Export all books under a PE folder to Excel files
- Clone-import of multiple files does not need data sheet to be active
- Option to install both Statistics and Life Science GUI modes and associated Apps
- Toggle between different GUI modes: Default, Stats, Life Science, Compact
- Independent GUI customization for each GUI mode
- Embedded Python is upgraded to latest version 3.14
Graphing
- Hold shift key when selecting text/graph tool to make it sticky to add a series of objects
- Set annotation color as Auto to follow plot color
- Distance annotation based on right Y axis
- Annotate minimum and maximum Z in 3D graph
- Set global symbol size, line width and pattern border width in graphs
- Set legend to wrap globally
- Mini toolbar to set legend position
- Mini toolbar to customize asterisk bracket labels
- Browser graph for easily viewing all graphs in a report sheet or branch
Data Handling
- Freeze title row & lock icon on top of hierarchical report sheet for easy access
- Mini toolbar to copy report table as HTML for easy pasting to AI
- Mini toolbar button to go to source or dependent for cells with cell formula/link
- Show image file type on status bar when clicking on a cell containing image
- Duplicate multiple folders to given names
- Use PE folder name as relative data path for import and batch process
- Activate same sheet in multiple books for quick comparison of same contents
- More Random Number Generator Functions such as disrnd2, bernrnd, laprnd, llgsrnd, sevrnd, levrnd
- Select multiple variables from Matlab, HDF and NetCDF data connectors to repeat the import